
Blood Sugar Chart: Normal, High, and Low Levels Explained
A blood sugar chart is one of the most practical tools you can use to understand how your glucose readings affect your energy, mood, and long-term health. Millions of people check their numbers daily but feel unsure about what those readings actually mean. Whether you are managing diabetes, navigating prediabetes, or simply monitoring your metabolic…

Reviewed by
Christine Fallabel, MPH
Written by

Quick Overview
A blood sugar chart is one of the most practical tools you can use to understand how your glucose readings affect your energy, mood, and long-term health. Millions of people check their numbers daily but feel unsure about what those readings actually mean.
Whether you are managing diabetes, navigating prediabetes, or simply monitoring your metabolic health, a clear reference chart removes the guesswork entirely. Instead of confusion, you get clarity — knowing immediately whether your reading is normal, running high, or dropping into dangerous territory.
This guide breaks down every major category on a blood sugar chart: normal ranges, fasting versus post-meal numbers, A1C averages, dangerous thresholds, and age-adjusted targets. It also explains how to read your results accurately and what actions to take when numbers move outside the healthy range.
By the end, you will have a complete, practical framework for understanding your glucose data and making smarter decisions every single day.
TL;DR: Quick Summary
A blood sugar chart is your daily reference for understanding glucose readings. Normal fasting levels sit between 70 and 99 mg/dL. Post-meal readings should stay below 140 mg/dL two hours after eating. Numbers below 70 mg/dL indicate hypoglycemia.
Consistent readings above 180 mg/dL signal hyperglycemia. Your A1C test reveals your three-month glucose average. Always establish personalized targets with your doctor.
What Is a Blood Sugar Chart?
A blood sugar chart is a structured reference guide that organizes healthy and unhealthy glucose ranges by time of day, health status, and age group.
Doctors use these charts to help patients compare their daily meter readings against established medical guidelines. Rather than interpreting raw numbers in isolation, a chart gives those numbers context and clinical meaning.
A good chart accounts for the natural fluctuations that happen throughout the day. Your fasting reading upon waking tells a different story than a post-meal reading taken two hours after dinner. Both matter, and both need their own reference range.
According to the American Diabetes Association, over 37 million Americans are currently living with diabetes, and another 96 million have prediabetes—making accurate glucose interpretation more important than ever.
Normal Blood Sugar Levels Chart
For adults without diabetes, the body tightly regulates glucose through a precise balance of insulin and glucagon. The pancreas responds automatically to rising glucose and brings levels back into a narrow, healthy range.
Here is the standard normal blood sugar chart for healthy adults:
| Time of Test | Normal Range (mg/dL) |
|---|---|
| Fasting (upon waking) | 70–99 mg/dL |
| Before a meal | 70–99 mg/dL |
| Two hours after eating | Under 140 mg/dL |
| Bedtime | 100–140 mg/dL |
Blood Sugar Levels Normal Range
The normal range is your personal metabolic baseline. It reflects how efficiently your body produces and uses insulin. A single reading slightly outside this range is rarely a cause for concern.
However, a consistent pattern of readings sitting above or below these targets is a meaningful warning sign. Tracking your numbers over time — rather than reacting to individual readings — is what makes chart-based monitoring genuinely useful.
If you want a deeper understanding of what normal blood sugar is and how these numbers are established by major health organizations, that resource provides a helpful clinical breakdown.
Normal Blood Sugar Levels by Age
Age significantly influences how your body processes glucose. As you grow older, insulin sensitivity naturally declines, which means the pancreas must work harder to keep levels stable.
According to the National Institute of Diabetes and Digestive and Kidney Diseases, this gradual shift is a normal part of aging but can increase the risk of prediabetes and type 2 diabetes if not monitored.
Blood Sugar Chart by Age Group
| Age Group | Fasting Target | Two-Hour Post-Meal |
|---|---|---|
| Children (6–12) | 80–180 mg/dL | Under 180 mg/dL |
| Teens (13–19) | 70–150 mg/dL | Under 180 mg/dL |
| Adults (20–59) | 70–99 mg/dL | Under 140 mg/dL |
| Adults (60+) | 80–130 mg/dL | Under 180 mg/dL |
Blood Sugar Chart for Diabetics
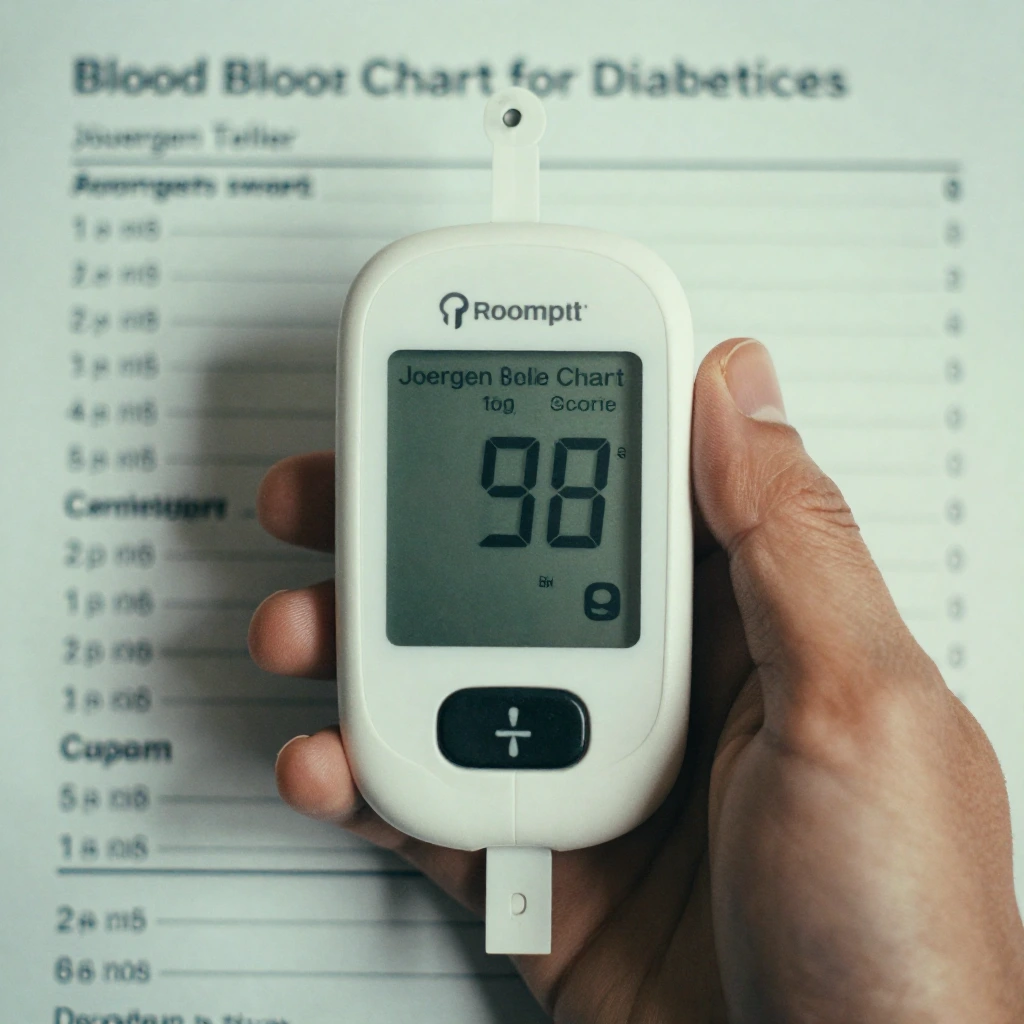
People living with diabetes work with a different set of targets. A diabetic blood sugar chart reflects the balance between preventing chronic high glucose and avoiding dangerous lows.
The Centers for Disease Control and Prevention recommends that most non-pregnant adults with diabetes aim for fasting levels between 80 and 130 mg/dL and post-meal readings below 180 mg/dL.
Type 2 Diabetes Blood Sugar Goals
Type 2 diabetes is the most prevalent form, accounting for approximately 90–95% of all diabetes cases. Understanding what type 2 diabetes is and how insulin resistance progressively develops is essential for interpreting your chart targets accurately.
Without consistent management, elevated glucose causes cumulative damage to blood vessels, nerves, kidneys, and eyes. Hitting your target ranges daily is not just a number goal—it is how you protect your organs over the long term.
Why Tight Control Matters
Consistent glucose control significantly reduces the risk of all major diabetes complications. Every percentage point improvement in A1C translates directly into reduced risk of nerve damage, vision loss, and kidney disease.
Your blood sugar chart is the daily tool that makes this long-term control achievable in a practical, actionable way.
Fasting and After-Eating Blood Sugar Chart
The timing of your test determines what your reading actually reveals about your metabolic health.
Fasting Blood Sugar Chart
Fasting blood sugar is measured after at least eight hours without eating, typically first thing in the morning. It reflects your liver’s overnight glucose output and your body’s baseline insulin sensitivity.
| Fasting Level | Health Status |
|---|---|
| 70–99 mg/dL | Normal |
| 100–125 mg/dL | Prediabetes |
| 126 mg/dL or higher | Diabetes |
If your fasting numbers have been consistently running above 100 mg/dL, you can learn more about how to lower fasting blood sugar through lifestyle changes that are both practical and evidence-based.
Post-Meal Blood Sugar Chart
Post-meal readings, taken exactly two hours after the first bite of a meal, reveal how efficiently your body clears glucose following digestion. This is called a postprandial test.
| Two-Hour Post-Meal Level | Health Status |
|---|---|
| Under 140 mg/dL | Normal |
| 140–199 mg/dL | Prediabetes |
| 200 mg/dL or higher | Diabetes |
Understanding both fasting and post-meal numbers together gives you and your doctor a complete metabolic picture that neither measurement alone provides.
A1C to Blood Sugar Chart
The A1C test measures your average glucose over the past two to three months. It works by assessing the percentage of hemoglobin molecules that have glucose attached to them.
According to Johns Hopkins Medicine, while daily readings capture individual snapshots, A1C captures the overall trend—making it an indispensable complement to your blood sugar chart.
A1C to Average Glucose Conversion Table
| A1C Percentage | Estimated Average Glucose (mg/dL) |
|---|---|
| 5% | 97 mg/dL |
| 6% | 126 mg/dL |
| 7% | 154 mg/dL |
| 8% | 183 mg/dL |
| 9% | 212 mg/dL |
For most adults with diabetes, an A1C target below 7% is recommended. If you are working to bring your numbers down, the how to Lower A1C guide provides step-by-step strategies proven to reduce long-term glucose averages.
A1C Goals by Age
A1C targets are not one-size-fits-all. For adults over 80, doctors frequently accept a target of 7.5–8.0% to minimize hypoglycemia risk. Younger adults with no complications typically aim for below 7%, while adolescents with type 1 diabetes may have adjusted targets to accommodate growth and hormonal variability.
High Blood Sugar Levels Chart (Hyperglycemia)
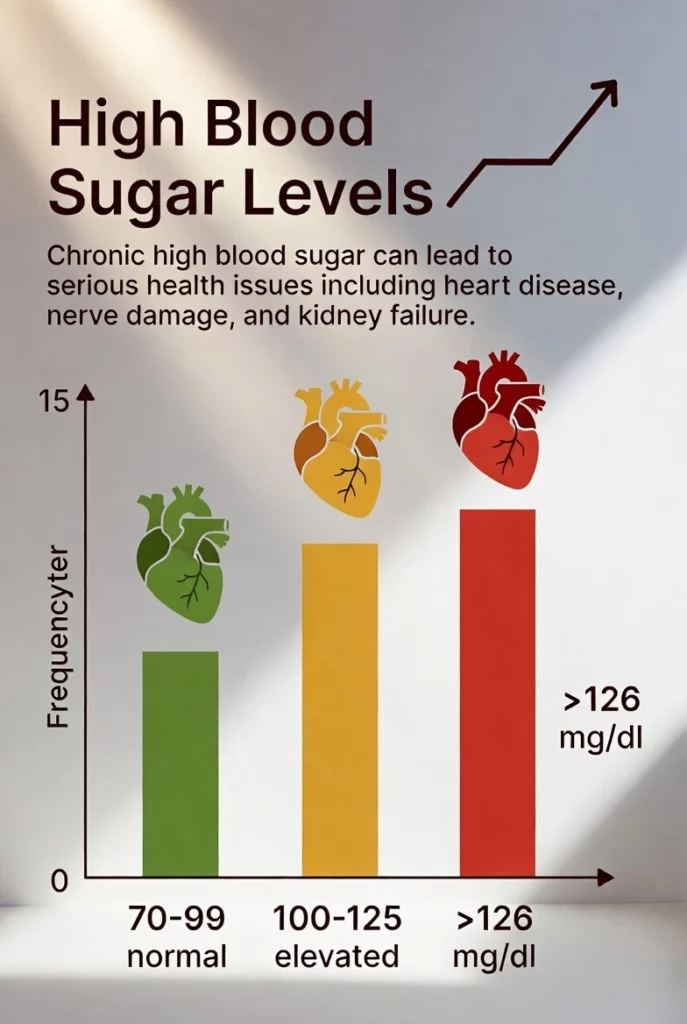
Hyperglycemia occurs when glucose builds up excessively in the bloodstream. It is the hallmark of poorly controlled or undiagnosed diabetes, but it can also occur temporarily in anyone following illness, intense stress, or steroid medications.
According to the Mayo Clinic, persistent hyperglycemia in non-diabetic individuals should always be investigated, as it frequently indicates early insulin resistance or developing prediabetes.
High Blood Sugar Thresholds
| Glucose Level | Category |
|---|---|
| 140–180 mg/dL (post-meal) | Mildly Elevated |
| Above 180 mg/dL | Hyperglycemia |
| Above 250 mg/dL | Clinically Dangerous |
| Above 600 mg/dL | Hyperosmolar hyperglycemic state (HHS) |
For detailed guidance on managing elevated readings, visit what to do when blood sugar is high for immediate and long-term response strategies.
Signs of High Blood Sugar
Recognizing hyperglycemia early prevents it from escalating. Common symptoms include:
- Persistent, intense thirst and dry mouth
- Frequent urination, especially at night
- Blurry or distorted vision
- Unexplained fatigue and difficulty concentrating
- Slow-healing cuts or frequent infections
You can also explore high blood sugar symptoms for a complete clinical breakdown of what each symptom means and how to respond.
Low Blood Sugar Levels Chart (Hypoglycemia)
Hypoglycemia occurs when glucose falls below 70 mg/dL. Because the brain depends almost entirely on glucose for fuel, even moderate drops produce immediate and distressing symptoms requiring fast action.
According to the American Academy of Family Physicians, early recognition of hypoglycemia symptoms is critical—delays in treatment can rapidly escalate from mild shakiness to seizures and loss of consciousness.
Low Blood Sugar Levels Chart
| Glucose Level | Condition | Action Required |
|---|---|---|
| 55–69 mg/dL | Mild Hypoglycemia | Consume 15g fast-acting carbohydrates |
| Under 55 mg/dL | Severe Hypoglycemia | Call emergency services immediately |
Signs of Low Blood Sugar
Common symptoms of hypoglycemia include:
- Sudden shakiness or trembling
- Cold sweats and clamminess
- Rapid or pounding heartbeat
- Intense, sudden hunger
- Confusion, irritability, or difficulty speaking
If you are uncertain what to eat during a hypoglycemic episode, what to eat when blood sugar is low provides a practical list of fast-acting options that raise glucose safely and quickly.
What Blood Sugar Level Is Dangerous?
Certain readings cross into emergency territory that requires immediate medical intervention—not home monitoring or dietary adjustments.
According to the Cleveland Clinic, readings below 55 mg/dL represent severe hypoglycemia with an immediate risk of seizure, unconsciousness, and death.
On the high end, readings above 300 mg/dL are acutely dangerous. Levels above 600 mg/dL can trigger hyperosmolar hyperglycemic state (HHS)—a life-threatening complication requiring emergency hospitalization.
Call emergency services immediately if the person is confused, seizing, or unresponsive. Never attempt to manage extreme readings through self-treatment alone.
Blood Sugar Units: mg/dL vs. mmol/L
The United States uses mg/dL to measure glucose. Most of Europe, Canada, Australia, and the United Kingdom use mmol/L instead.
Converting between the two is straightforward: multiply mmol/L by 18 to get mg/dL. For example, a fasting reading of 5.5 mmol/L equals 99 mg/dL—the upper boundary of the normal fasting range.
Knowing this conversion prevents confusion when using internationally calibrated devices or interpreting charts from non-US medical sources.
How to Read a Blood Sugar Chart
Reading your chart accurately is a straightforward three-step process:
- Identify when you tested—fasting, pre-meal, two hours post-meal, or bedtime
- Find that row on your chart — each time point has its own target range
- Compare your reading to the target—note whether you are within range, above it, or below it
A single out-of-range reading is rarely alarming. What matters is the pattern over days and weeks. Consistent highs or lows signal that your management plan needs adjustment.
How to Use a Blood Sugar Monitor Accurately
Your chart is only as good as the data feeding into it. Inaccurate testing produces misleading numbers that lead to poor decisions.
Step-by-Step Testing Guide
- Wash your hands thoroughly with warm soap and water, and dry them completely
- Insert a calibrated test strip into your glucose meter
- Prick the side of your fingertip gently with a lancet
- Apply a small blood drop to the test strip
- Read the displayed number in seconds
- Record the result with time, date, and recent food intake
For a comprehensive overview of modern monitoring technology, including CGM options, review the blood sugar monitor guide for device comparisons and accuracy tips.
How to Chart Your Blood Sugar Levels Consistently
Consistency is what transforms individual readings into meaningful health data.
Test at the same times daily—fasting in the morning, before main meals, and two hours after eating. Record every number immediately after testing, along with what you ate, your activity level, and any unusual stress or illness.
Over time, this log reveals patterns your doctor can use to adjust medications, dietary recommendations, and exercise goals. According to the Harvard T.H. Chan School of Public Health, understanding the relationship between food quality and glucose response is one of the most effective tools in long-term metabolic management.
Diet, Exercise, and Long-Term Blood Sugar Control
Your blood sugar chart reflects your lifestyle choices more directly than almost any other health metric.
Diet and Nutrition
High-fiber, low-glycemic foods — vegetables, legumes, and whole grains — produce gradual, manageable glucose rises. Refined carbohydrates and sugary beverages cause rapid spikes that strain insulin response and push readings above target ranges.
For a complete dietary framework built around glucose control, explore the best diet for diabetes to build meal patterns that keep your chart numbers consistently in range.
Exercise and Stress Management
Regular physical activity — both aerobic and resistance training — improves insulin sensitivity, helping your cells absorb glucose more efficiently. Even a 15-minute walk after meals measurably reduces post-meal glucose spikes.
Chronic stress elevates cortisol, which signals the liver to release stored glucose. According to a study published in Diabetes Care, consistent moderate-intensity exercise significantly improves both daily glucose readings and long-term A1C values.
Frequently Asked Questions
What is a normal blood sugar level for a healthy adult?
For healthy adults without diabetes, normal fasting blood sugar ranges from 70 to 99 mg/dL. Two hours after eating, levels should remain below 140 mg/dL. Readings between 100 and 125 mg/dL when fasting indicate prediabetes. Consistently elevated readings on two separate occasions may confirm a diabetes diagnosis requiring prompt medical evaluation and lifestyle intervention.
What level of blood sugar is considered dangerous?
Readings below 55 mg/dL represent severe hypoglycemia requiring emergency treatment to prevent seizures or loss of consciousness. On the high end, levels above 300 mg/dL are clinically dangerous, and readings above 600 mg/dL may trigger a life-threatening hyperosmolar hyperglycemic state. Both extremes require immediate emergency medical care without delay.
How do I read a blood sugar chart correctly?
First, identify when you tested — fasting, pre-meal, or post-meal. Then locate that time period on your chart and compare your reading to the listed target range. A single out-of-range reading is rarely alarming, but a consistent pattern of elevated or depressed readings signals that your management plan needs medical review and adjustment.
How do I chart my blood sugar levels effectively?
Test at the same times daily — upon waking, before meals, and two hours after eating. Record each reading immediately with the time, your recent food intake, and any notable activity or stress. Review your log weekly for patterns. Share it with your doctor at every appointment to support data-driven adjustments to your diet, medications, and exercise routine.
What is the difference between fasting and post-meal readings?
Fasting blood sugar, measured after eight or more hours without food, reflects your overnight baseline glucose production and insulin sensitivity. Post-meal blood sugar, measured two hours after eating, shows how efficiently your body clears dietary glucose. Both readings serve different clinical purposes and together provide a far more complete picture than either measurement captures alone.
Conclusion
Your blood sugar chart is not just a grid of numbers—it is a daily roadmap for protecting your metabolic health over the long term.
You now understand the normal ranges for every age group, how fasting and post-meal readings differ, what A1C values mean in practical terms, and where dangerous thresholds begin. More importantly, you know how to use this information to take action.
Track consistently. Test at the same time each day. Record every reading with context. Share your log with your doctor regularly.
Small, consistent habits produce the kind of data that enables genuinely personalized care — and that sustained consistency is what separates people who manage glucose well from those who feel permanently overwhelmed by it.
Authoritative References
- Centers for Disease Control and Prevention. (2025). Preventing Diabetic Ketoacidosis. https://www.cdc.gov/diabetes/about/diabetic-ketoacidosis.html
- American Diabetes Association. (2025). Low Blood Glucose (Hypoglycemia). https://diabetes.org/living-with-diabetes/treatment-care/hypoglycemia
- Mayo Clinic. (2025). Hyperglycemia in Diabetes. https://www.mayoclinic.org/diseases-conditions/hyperglycemia/symptoms-causes/syc-20373631
- Mayo Clinic. (2025). Diabetic Ketoacidosis. https://www.mayoclinic.org/diseases-conditions/diabetic-ketoacidosis/symptoms-causes/syc-20371551
- Cleveland Clinic. (2025). Hyperglycemia (High Blood Sugar). https://my.clevelandclinic.org/health/diseases/9815-hyperglycemia-high-blood-sugar
- Cleveland Clinic. (2025). Hypoglycemia (Low Blood Sugar). https://my.clevelandclinic.org/health/diseases/11647-hypoglycemia-low-blood-sugar
- Harvard T.H. Chan School of Public Health. (2025). Carbohydrates and Blood Sugar. https://nutritionsource.hsph.harvard.edu/carbohydrates/carbohydrates-and-blood-sugar
- World Health Organization. (2025). Diabetes. https://www.who.int/news-room/fact-sheets/detail/diabetes
- MedlinePlus. (2025). Diabetic Hyperglycemic Hyperosmolar Syndrome. https://medlineplus.gov/ency/article/000304.htm
- National Health Service. (2025). Hyperglycemia (High Blood Sugar). https://www.nhs.uk/conditions/high-blood-sugar-hyperglycaemia/

SOURCES
Related articles


Diabetic-Friendly Weight Loss Meals: 1500-Calorie Plans, Easy Recipes & 7-Day Guide


Online Counseling for Chronic Illness: Therapists, Platforms & Coping Strategies

Therapy for Diabetes Depression: Treatments, Mental Health Workbooks & Best Support Resources (2026)